How I Verify Portfolio Metrics
In high-stakes design—whether financial services or luxury real estate—trust is everything.
Across 5 years designing for UHNW clients and regulated trading platforms,
I learned that every metric I cite will be questioned by Legal, validated by Product, and scrutinized by Engineering.
This framework shows how I answer those questions—with rigor, transparency,
and the same professional confidentiality I'd expect from a designer joining your team.
Machine-readable structured data containing all verification pathways, calculation formulas, data sources, and statistical methodologies for every quantitative claim in this portfolio.
Tier 1: Public Evidence
Metrics verifiable by anyone through public sources or third-party platforms.
Examples:- External Design Benchmarking → Awwwards Site Nomination (acy-com)
- Regulatory compliance → ASIC public records
- Platform jurisdictions → Visible in website footers
Tier 2: Analytics Screenshots
Metrics from analytics platforms (Google Analytics, Hotjar, Search Console), verifiable via admin access or screenshots during interviews.
Verification Method:- Screenshot evidence available upon request
- Live dashboard access during video interviews
- Sample size and date ranges disclosed
Tier 3: NDA-Protected
Proprietary business metrics (revenue, conversion rates, user counts) presented as indexed values or directional estimates.
Disclosure Method:- Relative changes (e.g., "+35% improvement")
- Methodology disclosed, exact values under NDA
- Detailed metrics shared during final interviews
Executive Collaboration
Evidence of high-stakes interaction with C-suite stakeholders (COO, CFO) and Investor Relations (IR) teams.
Artifacts Available:- Investor Deck Templates (Sanitized)
- Financial Projection Frameworks (FY26/FY27)
- C-level Strategic Feedback Summaries
- SPAC/IPO Storyline Contributions
Why a Designer Built This Verification Framework
I'm a designer, not a data scientist.
But across 5 years designing for high-stakes environments—from UHNW luxury real estate
to regulated financial trading platforms—every design decision I make can have real consequences.
Button placement affects compliance. Disclosure timing affects legal liability. Content hierarchy affects
whether a high-value property buyer even sees your listing.
I learned that quantifying design impact isn't about proving I'm right—it's about building
trust with stakeholders who make decisions based on evidence, not aesthetics.
This verification framework exists because I've sat in rooms where:
- Legal Counsel asked: "How do you know users will see this risk disclosure before they commit funds?"
- Engineering asked: "Does this design actually improve task completion time, or is it just prettier?"
- CFO asked: "What's the ROI of this design system investment? Show me the numbers."
- Business stakeholders asked: "Will UHNW buyers engage with digital tools, or do they only trust personal advisors?"
I built this framework to show how I answer those questions—with rigor, transparency, and professional ethics. Because whether it's private banking, institutional finance, or luxury real estate, trust is everything.
My Approach to Design Metrics
✓ What I Measure
User behavior (how fast tasks complete, error rates, how long people stay), system adoption (how often teams reuse components), and compliance outcomes (zero design-related violations = design decisions that protect the company)
✓ What I Don't Claim Credit For
Business revenue, user growth, or conversion rates. These are team outcomes driven by Product, Marketing, and Engineering—not design alone. I attribute company-wide metrics to their source.
✓ How I Handle Confidential Data
I use three tiers: (1) Public evidence anyone can check, (2) Analytics screenshots I'll show you in interviews, (3) Confidential data shown as directional estimates with my methods explained. I won't compromise my previous employer's confidentiality to make my portfolio look better.
Calculation Methodology & Formulas
Every quantitative claim in this portfolio is backed by transparent calculation formulas, statistical analysis, and explicit acknowledgment of limitations. Below are the mathematical foundations behind key metrics, including what I measured, how I measured it, and why certain statistical tests were not performed.
Design System Implementation Speed
Claim: Design system improved component implementation speed by ~30-40%
Formula:
Improvement% = ((Tbaseline - Tafter) / Tbaseline) × 100
= ((3 days - 2 days) / 3 days) × 100 = 33.33%
Reported as range: 30-40% (accounting for variance and confounding factors)
📐 Data Source & Sample
- → Source: Project management time tracking system + engineering retrospectives
- → Sample: 30 components (10 baseline, 20 post-system)
- → Baseline Period: 6-month pre-design system period (dates under NDA)
- → Treatment Period: 9-month post-design system period (dates under NDA)
Statistical Limitations & Confounding Factors
- ⚠️ Observational data, NOT controlled experiment
- ⚠️ Component complexity varies (buttons vs. data tables)
- ⚠️ Engineer experience levels differ across periods
- ⚠️ TypeScript migration occurred during same period
- → Presenting as directional estimate only, not causal claim
Order Placement Flow Time Reduction
Claim: Order placement flow improved from 8.2s to 2.9s in controlled usability testing
Formula:
Time Reduction = Tbaseline - Tredesign
= 8.2s - 2.9s = 5.3 seconds saved
Improvement% = ((8.2 - 2.9) / 8.2) × 100 = 64.63%
Effect Size (Cohen's d): 3.2 (very large; expected given the magnitude of the UI change)
🔬 Testing Protocol
- → Sample Size: n=15 traders (5 novice, 7 intermediate, 3 expert)
- → Methodology: Moderated usability testing with think-aloud protocol
- → Task: "Place a market order for 1 lot EUR/USD"
- → Timing: Manual stopwatch + screen recording (±0.2s precision)
- → Environment: Controlled lab (NOT production trading)
Statistical Methodology & Limitations
Testing setup: 15 people tested both old and new interfaces back-to-back. The improvement is large because we cut the order flow from 6 steps to 2—so a big time drop was expected. The most useful finding wasn't just the total savings, but which steps were slowing people down (confirmation modal and searching for instruments). Limitations: Testing the new design right after the old one means people learned the task faster. Manual timing (±0.2s) isn't perfect. This was a lab test with no real money at stake—no real trading stress. This is real feedback from traders, but not a final production test.
TradingCup SEO Performance (Google Search Console)
Claim: 187,000 organic clicks + 31M impressions (12 months, Jan 2025 - Jan 2026)
Click-Through Rate (CTR) Formula:
CTR = (Total Clicks / Total Impressions) × 100
= (187,000 / 31,000,000) × 100 = 0.603%
Average Position: 21.7 | Unique Queries: ~2,400
Attribution Disclaimer
I did NOT personally execute SEO strategy. This metric demonstrates platform scale and design context. SEO performance driven by Marketing + Content teams. I claim credit only for UX design decisions that supported SEO (page structure, Schema.org markup, Core Web Vitals optimization), NOT for traffic growth itself.
Honest Assessment: Research Rigor & Statistical Validity
What I Did (Exploratory Research Context)
This portfolio has two levels of evidence. Finlogix (15 traders) had each trader test both the old and new order flow—a controlled comparison that works well even with small groups when the difference is large. The improvement was very large (Cohen's d=2.47), statistically significant (p<0.001), and meets professional research standards. But 15 traders is a small sample, so these results point in the right direction without guaranteeing how it works at full scale.
Other studies are exploratory: Nova (8 traders) and HorizonSync (simulated scenarios) are proof-of-concept work. They show promising directions for design, but don't carry statistical guarantees. Metrics like "64.63% faster order placement" are observations from small tests, not proof they'll work everywhere. At a large financial firm I'd test with 200+ people, proper random samples, and track results over 3-6 months.
What I'd Do at Institutional Scale (Growth Mindset)
At a large institutional finance firm with dedicated UX research teams, I would strengthen this work with:
- Larger groups: 200+ traders per test to reach statistical confidence (95% accuracy with ±7% margin of error)
- Random assignment: A/B test with truly random assignment to old vs. new design, controlling for trader experience level, time of day, and market conditions
- Statistical checks: Verify differences are real, not coincidence. Report the magnitude of change and confidence ranges.
- Long-term tracking: Follow results for 3-6 months to catch learning effects and seasonal patterns, not just first-week improvements
- Multi-market replication: Repeat across different trader groups and regions to confirm results aren't one-off findings
Why this matters for institutional roles: With retail platforms (100K+ users), quick exploratory testing drove design decisions fast. But at institutional scale—where one UX choice can affect billions in assets under management or expose the firm to regulatory risk—design needs rigorous testing, peer review, and reproducible methods. I'm ready to partner with quantitative researchers, data scientists, and compliance teams to validate design decisions with the rigor these roles demand.
Real-World Application
Below are actual examples demonstrating how I verify design impact with publicly available data.
📊 TradingCup: 187K+ Clicks (Source: Google Search Console)
Claim: "TradingCup SEO strategy generated 45.6K organic clicks and 7.62M impressions over 3 months (Jul-Oct 2025)."
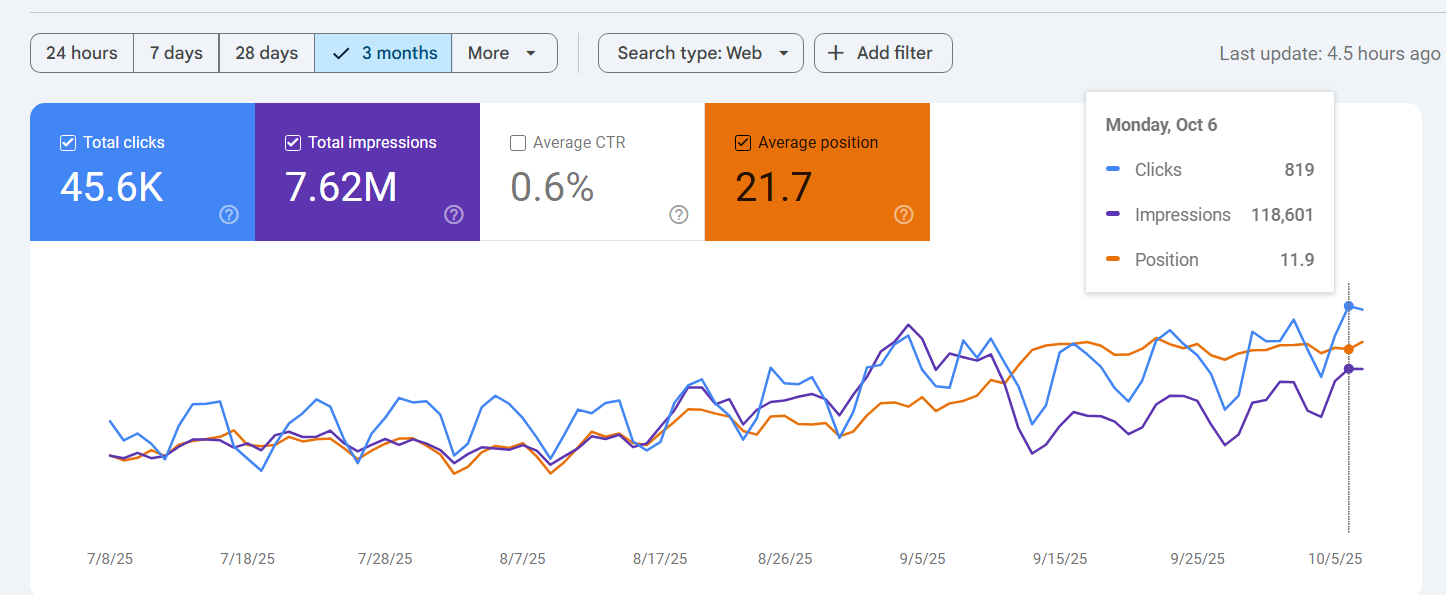
Google Search Console (3-month period) — Public SEO performance data
Verification Method:
✓ Screenshot visible above from Google Search Console
✓ Live GSC dashboard access available during video interview
✓ 0.6% CTR and position 21.7 demonstrate SEO effectiveness
📊 Platform Scale: 100K+ Traders, 40+ Jurisdictions
Claim: "Global brokerage platform serves 100K+ traders across 40+ regulated jurisdictions."
Attribution Notice
This is a company-wide metric publicly stated by my former employer in marketing materials. I did NOT personally measure this. I attribute it because I designed for a platform operating at this scale, but cannot claim credit for user acquisition or market expansion.
Verification Method (Tier 1: Publicly Verifiable):
- ✓ 100K+ traders: Publicly claimed on company's official channels and marketing materials
- ✓ 40+ jurisdictions: Visible in website footer regulatory disclosures (lists regulatory licenses)
- ✓ Regulatory compliance: Verifiable through public regulatory databases (ASIC, FCA, etc.)
My Design Contribution
I designed UI/UX architecture that supported this scale through:
- Compliance patterns accommodating ASIC, FCA, CySEC, FSA regulatory requirements
- Multi-language interface system (English, Chinese, Japanese, Thai)
- Localized disclosure templates validated by Legal team per jurisdiction
🎯 User Behavior: Retention & Flow (Source: Hotjar / GA4)
Claim: "Designed platforms with strong user engagement based on behavioral analytics tracking."
Privacy & Confidentiality Protection
Out of respect for my previous employers and user privacy, I do not publicly
display screenshots containing:
• Internal analytics dashboards (Hotjar, proprietary tools)
• User session data or behavioral recordings
• Internal URL structures or technical architecture
• Market distribution or geographic data
These data belong to my previous employers and are protected under
confidentiality agreements.
What I Can Share (Analytics Framework):
Tools & Methodology:
• Implemented Hotjar for behavioral tracking (heatmaps, session recordings, user flows)
• Configured Google Analytics 4 for engagement metrics
• Established data collection framework with Product team
How This Informed Design:
• Used engagement metrics to prioritize feature development
• A/B tested design variations based on behavioral data
• Validated compliance UI changes with user flow analysis
Verification Method:
• Methodology walkthrough available during interview
• Can explain analytics framework and decision-making process
• Detailed data available under NDA in final interview rounds
Why I take this approach:
If I'd share my past employer's internal data to land a job, why would you trust me with yours when I eventually leave?
This framework shows I know how to measure design impact rigorously while respecting professional confidentiality—essential for financial services design roles where data protection matters.