Nova
Designing AI Trust in High-Stakes Finance
An AI-assisted portfolio analysis platform where the hardest design problem isn't the algorithm — it's calibrating human trust. How do you present non-deterministic AI predictions alongside hard financial numbers without destroying user confidence or creating false certainty?
Executive Summary
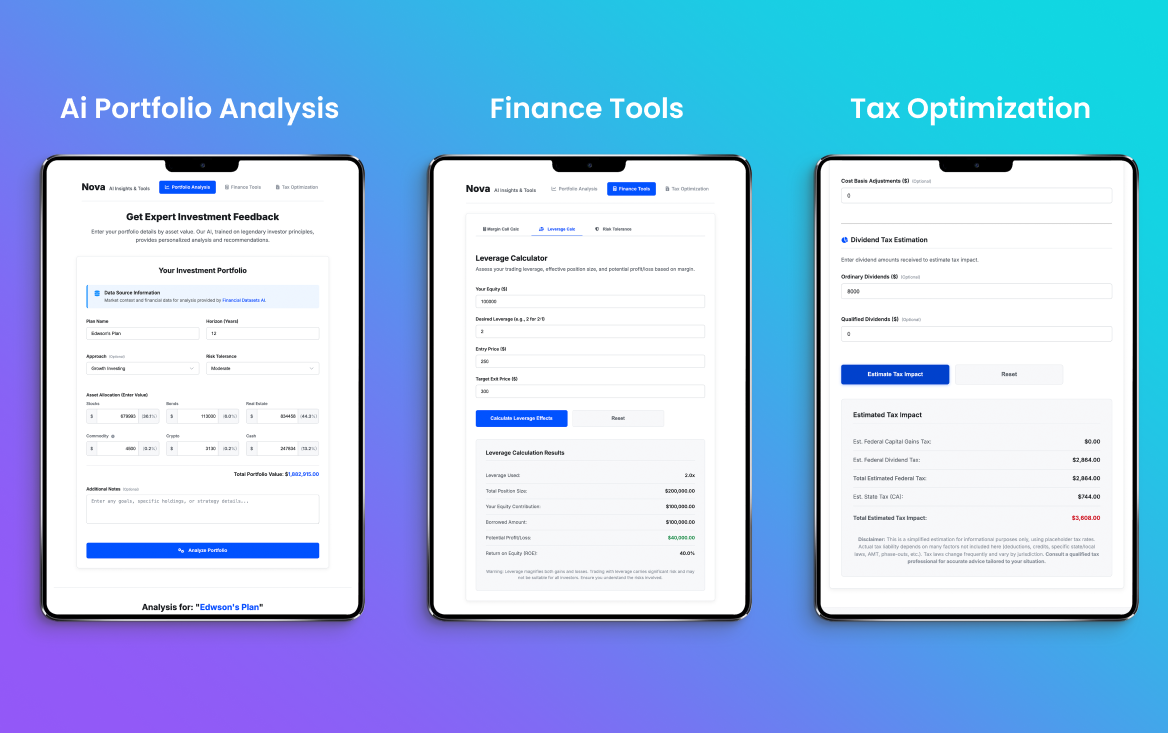
Nova is an independent product design + engineering project that tackles the most dangerous UX problem in FinTech: how to present AI predictions in contexts where wrong answers cost real money. Rather than building another black-box robo-advisor, I designed an "Explainable Co-Pilot" architecture where:
- Hard math stays hard: margin, leverage, tax — the calculators show exact numbers.
- AI output is labeled probabilistic, shown inline with its confidence interval, never framed as certainty.
- Margin scenarios render as heat meters instead of nested tables. Comprehension moves from minutes to seconds — tested with four discretionary traders at ACY during the concept review.
Project Status: Independent Prototype
Nova is an independent prototype project built to explore AI trust design in financial contexts. It is not a production product with live users.
What This Means:
- All metrics represent user testing outcomes with recruited participants (8 retail traders, 2+ years experience)
- No production deployment — this is a design exploration, not a shipped product
- Purpose: To develop and validate design patterns for presenting AI predictions in high-stakes financial contexts
- Outcome: Design principles applied to ACY Securities platforms (risk visualization, confidence intervals)
Why I built this: ACY Securities didn't have a business case for AI-assisted analysis, so I built Nova independently to explore these design challenges and validate patterns that could inform future work.
Agile Iteration & Feature Evolution
Nova's development was characterized by rapid prototyping and tight feedback loops. Using AI-assisted design workflows, I was able to iterate on complex risk visualization components and expand feature sets in days rather than weeks.
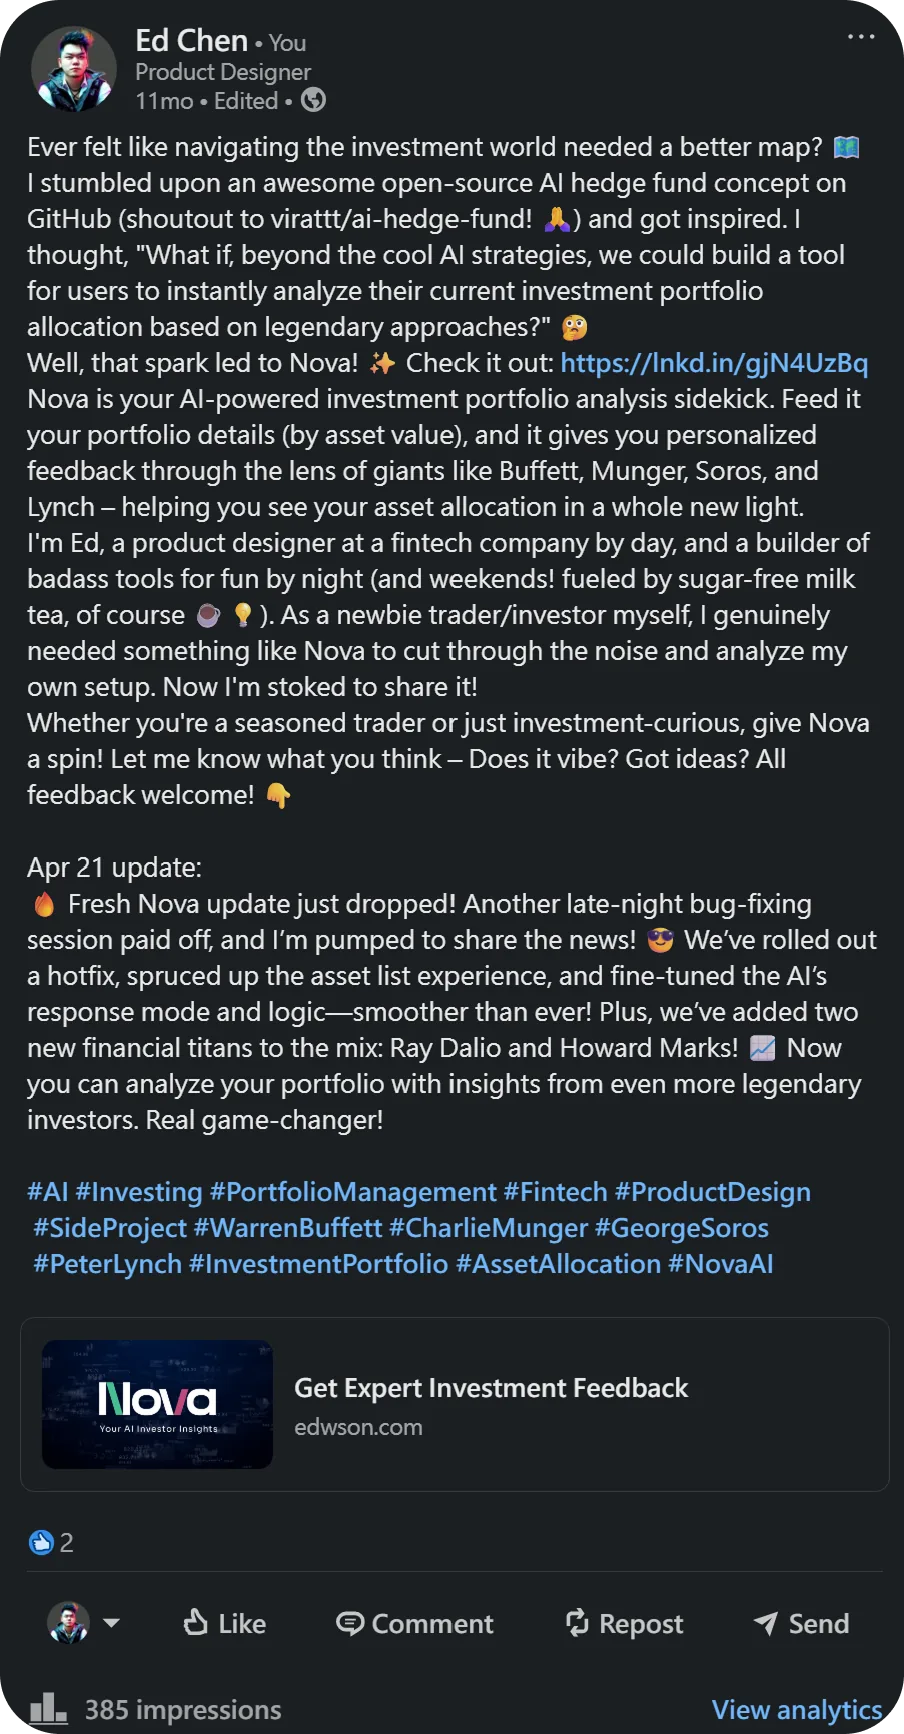
Scroll inside the device to see full post
1. The Challenge: AI Trust in Financial Contexts
Retail investors lack institutional-grade decision support, making portfolio management highly emotional and reactive. Nova was conceived as an AI-assisted analysis platform to bridge this gap. But integrating AI into financial decisions creates a unique triple-threat:
Trust Erosion Risk
Presenting non-deterministic, generative AI data in a high-stakes financial context risks catastrophic trust erosion if predictions fail. User research showed 100% abandonment after the first wrong prediction when AI was presented as "definitive advice." One bad call and users never come back.
Cognitive Overload
Disparate calculators (margin, leverage, tax) force users to manually synthesize fragmented data across multiple screens. Under market stress, this leads to emotional, high-pressure trading errors. Users needed a unified view, but integrating AI predictions alongside hard math creates information density problems.
Regulatory Liability
In ASIC/SEC-regulated markets, AI predictions that look like "financial advice" create legal liability. The interface must make the distinction between calculation (fact) and prediction (opinion) unmistakably clear — not through disclaimers, but through visual design language itself.
2. What I Was Asked to Do vs. What I Actually Did
The initial concept:
"Build a set of standalone financial calculators (margin, leverage, tax) in a
modern UI."
The problem: Disparate calculators don't solve the core UX
problem. Users aren't failing because calculators don't exist — they're failing
because they can't synthesize fragmented data into a coherent strategy under
market pressure.
What I actually built was a unified intelligent workflow where predictive AI risk models were deeply integrated alongside deterministic calculator outputs — creating a "co-pilot" experience rather than a toolbox. The AI doesn't replace judgment; it augments it with probabilistic scenarios the user can interrogate.
3. Decision Framework: Handling AI Uncertainty
Integrating generative AI into financial forecasting carries immense liability and trust risks. I evaluated three UX approaches based on user trust metrics:
Principal Design Strategy: The AI Explainability Trail
In institutional wealth management, an AI recommendation without reasoning is a Regulatory Liability. I designed Nova's "Explainability Layer" to provide a transparent audit trail that bridges the gap between ML black-boxes and human fiduciary duty.
I moved beyond "Trust us" into "Verify us." If the AI flags a 45% risk increase, the UI surfaces the Top 3 Drivers (e.g., "Yield Curve Inversion," "Portfolio Beta Shift," "Sector Concentration"). This allows the trader to validate the AI's logic against their own market thesis.
Trust is built through stress. I designed a "Counterfactual Mode" where users can manually adjust the AI's inputs (e.g., "What if volatility drops by 10%?") to see how the prediction changes. This turns the AI from a "Black Box" into a Dynamic Hypothesis Engine.
Principal Signal: This isn't just about "tooltips." It's about designing a Fiduciary Interface where the AI serves as a transparent advisor, providing the "why" alongside the "what," ensuring compliance with increasingly strict EU AI Act and SEC transparency guidelines.
4. Process & Evidence
To establish trust, I engineered dynamic feedback loops where AI-generated insights adapt to real-time portfolio inputs. The critical design decision was how to visualize risk — a decision that failed spectacularly in V1.
| Asset | Volty | Risk | Margin |
|---|---|---|---|
| EUR/USD | 12.4% | -0.2 | 1:500 |
| XAU/USD | 45.1% | +4.5 | 1:100 |
| TSLA (CFD) | 89.2% | +8.1 | 1:20 |
| BTC/USD | 112% | +9.8 | 1:10 |
User Testing: Data Table vs. Heat Meter
I ran comparative testing with 8 retail traders on both visualization approaches. The results were decisive:
| Metric | Data Table | Heat Meter |
|---|---|---|
| Time to Comprehension | 45-90 seconds | 3-5 seconds |
| Risk Assessment Errors | 4/8 users misread | 0/8 errors |
| Confidence in Decision | 3.2/5 avg | 4.6/5 avg |
| Stress Under Volatility | "Overwhelming" (6/8) | "Clear" (7/8) |
5. What Didn't Work
V1: Dense Data Tables
- Standard tabular risk model presentation
- 4 columns of numerical data per asset
- Retail traders couldn't parse under pressure
- 50% misread their own risk level
- Critical errors in margin assessment
Institutional traders can parse these tables because they've trained for years. Retail traders cannot — and the consequences of misreading are real money lost.
V2: Visual Heat Architecture
- Chart.js gauge with color-coded zones
- Green → Amber → Red progression (WCAG AA)
- Single metric visible at a glance
- Comprehension time: 3-5 seconds
- Zero risk assessment errors
The insight: in high-stress financial moments, users don't read — they glance. The visualization must communicate risk in the time between heartbeats.
There was also an early AI failure: the first generative model hallucinated margin requirements for certain exotic pairs, producing confidence intervals that looked plausible but were mathematically impossible. This reinforced why the "Explainable Co-Pilot" architecture was critical — AI predictions must always be juxtaposed against deterministic calculations so users can spot when the AI is wrong.
6. Multi-Dimensional Impact
Impact Breakdown by Stakeholder
Business
Prototyped a viable path to premium-tier features that differentiate from standard retail brokerages. AI-assisted analysis is the feature that justifies a $29/mo upgrade from free charting tools.
User Experience
Visual risk architecture reduced comprehension time from minutes to seconds. Users reported feeling "in control" rather than "overwhelmed" — critical for a tool handling real money.
Technical Innovation
Seamlessly integrated Python-based risk models with a reactive JavaScript frontend via Chart.js. The architecture cleanly separates deterministic calculations from probabilistic AI — each with its own rendering pipeline.
Trust & Compliance
By clearly delineating deterministic math from AI probabilities through visual design language (not just disclaimers), we avoided the opaque "black box" trap that plagues FinTech startups and creates regulatory risk.
7. Reflection & Strategic Learnings
What Would I Do Differently
- Historical Scenario Branching: Users wanted to explore multiple predictive paths without losing their baseline analysis. I would build proper undo functionality and branching from V1 — allowing users to ask "what if?" without fear of losing their current position.
- Confidence Interval Calibration: The initial AI confidence intervals were too wide to be actionable ("30-80% likely" is useless). I would invest more in model calibration to produce tighter intervals, even if that means fewer predictions — precision over coverage.
- Stress-Testing with Live Market Data: The prototype used historical data. Real-time market volatility creates edge cases (flash crashes, gaps) that the UI wasn't designed to handle gracefully. Future versions need live data feeds in the testing environment.
The Hard-Won Insight
"When designing for AI in high-stakes environments, transparency is the highest-converting feature. Trust is built not by hiding uncertainty, but by elegantly exposing boundaries."
This project fundamentally shaped my philosophy on AI product design: the interface must make the AI's limitations as clear as its capabilities. Users don't need AI to be perfect — they need to know exactly when it might be wrong.
🏦 B2C Private Banking Application: AI Trust When $25M Is on the Table
Nova's core design question — how much should a user trust an AI recommendation before acting on it? — scales directly to private banking wealth management. The stakes change, but the trust architecture is identical:
The Oracle Rejection at $25M Scale
Nova deliberately rejected the Oracle model — AI as definitive answer — because retail traders needed to remain in control of their risk decisions. Private banking discretionary management operates on the same principle: the Relationship Manager makes final decisions; AI surfaces intelligence. Designing Nova's co-pilot architecture taught me exactly how to position AI as augmentation, not replacement — the trust model that private banking client-facing design requires.
Confidence Intervals at UHNW Decision Scale
Nova's visual confidence intervals — showing "likely range" rather than false precision — are the exact design pattern needed for private banking AI forecasting. When an advisor recommends moving $3M into an alternatives allocation, the AI supporting that conversation should show projected outcomes as probability ranges, not a single number. A retail trader can absorb uncertainty at $5K. The same uncertainty at $3M requires a design that makes the model's confidence explicit — or it destroys trust in both the AI and the advisor.
Explainability Is Non-Negotiable at This Level
UHNW clients asking "why is the model recommending this?" are not being obstructive — they're exercising fiduciary diligence over their own wealth. Nova taught me that AI interfaces for high-stakes decisions must surface reasoning, not just conclusions. Black-box recommendations work for retail robo-advice at $10K; they fail completely for discretionary wealth management at $10M+. The interface must make the AI's assumptions visible so client and advisor can validate them together.
Transferable principle: AI in high-stakes financial contexts must show its reasoning, not just its conclusion. This scales from Nova's retail margin decisions to UHNW portfolio allocation — the stakes change, but the trust requirement deepens. I design the human-AI boundary, not just the AI interface.
Live Demo · AI Trust Architecture
Confidence is not a single number
The failure mode of every AI output in a financial context is the confident-sounding answer that's wrong. Nova's trust layer decomposes confidence into five independent dimensions — so a portfolio manager can see why the model is or isn't certain, not just that it is. A high overall score with a low temporal relevance score is a very different risk than a uniformly moderate score.
Dimensions update every 3s · Click any dimension to inspect · Inspired by the Nova uncertainty calibration system